
Oh the many wondrous things to see!
Northern lights above R/V Ocean Starr night of September 11th. Photo credit: Ryan McCabe
Scattered ‘round the lab is a horde of blinking lights and screens flashing with maps and graphs. Microscopes and measuring utensils fill in the few open lab table spaces of the stations in which everyday progress occurs. Each lab station has been a flurry of fish sorting, water filtration systems, counting and calculating. Every day we do either two or three checkpoints. Work at one station can last 3 to 4 hours depending on the size of a haul. Computer monitors and TV screens are everywhere. One of our communication sources tells us when we will arrive at our next checkpoint, another portrays (in most cases) a polychromatic, ever-changing ‘echogram’ that represents the animals below.
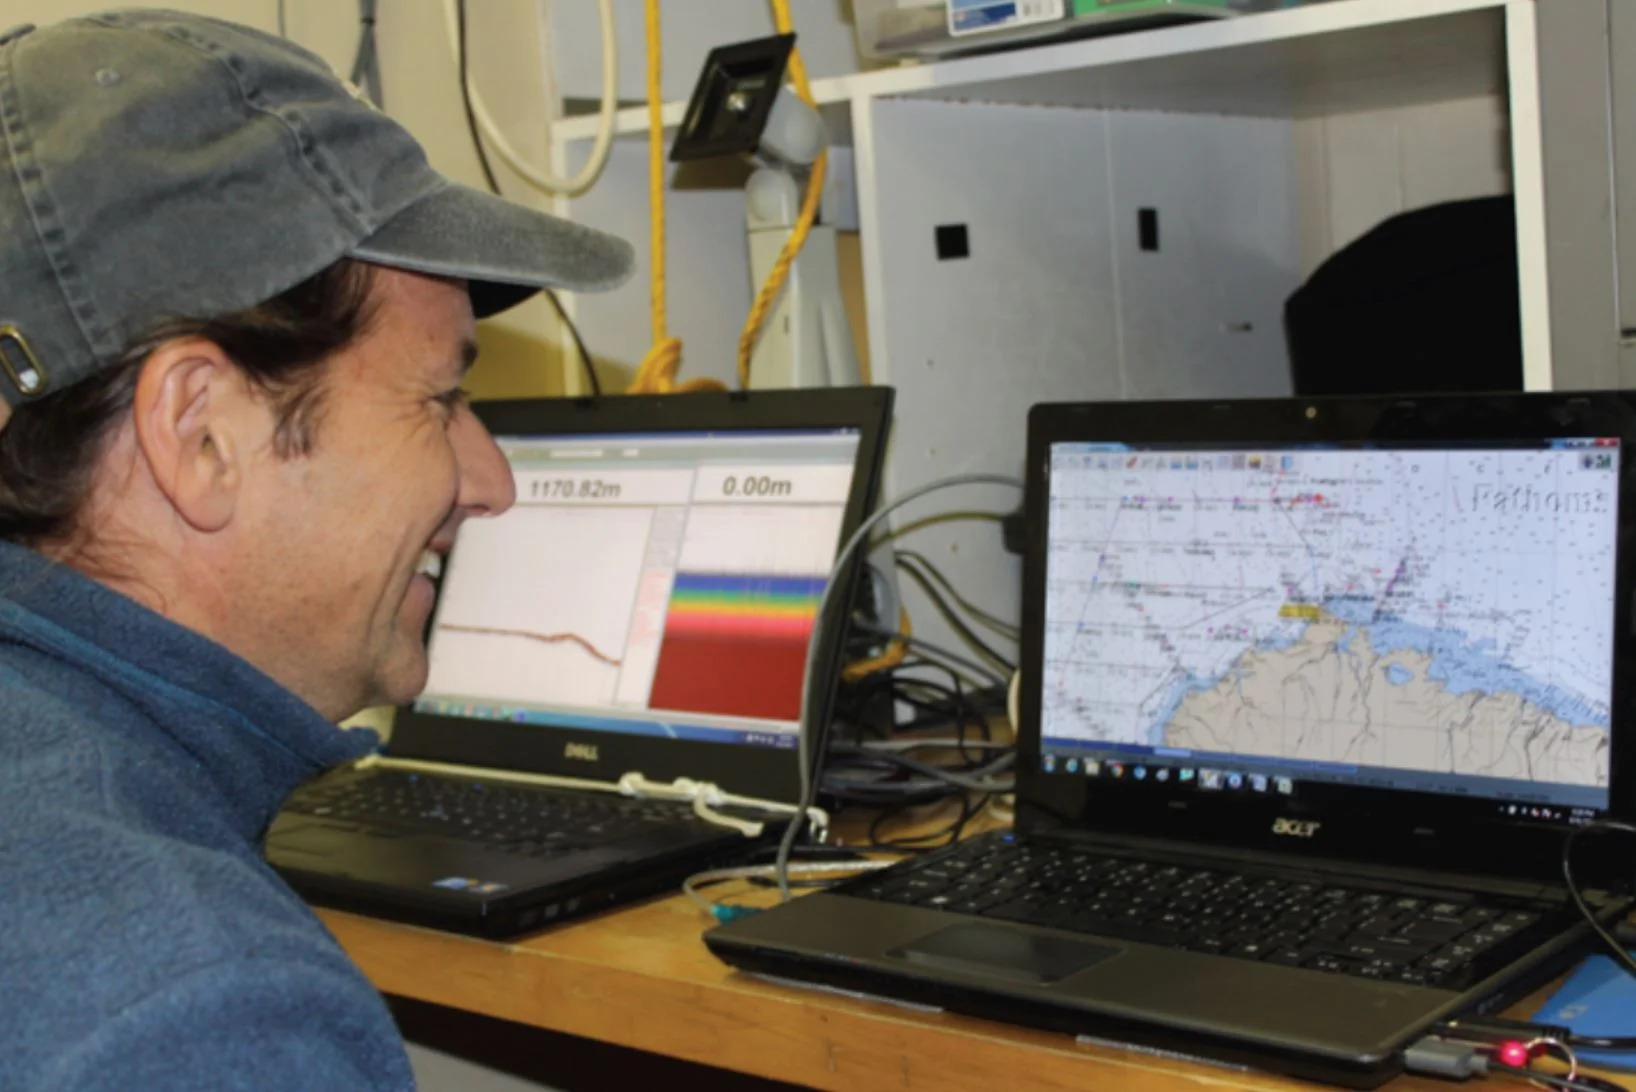
Alex De Robertis explaining the mechanisms of the echogram and an interactive map.Photo credit: Alicia Flores
This colorful echogram is used for the acoustic trawl survey, which is eye-catching with its rainbow-like display, and it allows us to visualize the abundance of marine life below. Arctic cod is one of the many fish found, and correlates with the echo measurements bounced back. A transducer cable on the hull of the ship sends out a “ping” as a signal is sent downward twice a second and reflects off the fish below. Then Alex DeRobertis can measure how much sound is reflected to gain information on the abundance and distribution of different species. For example, zooplankton are detected more strongly in higher frequencies of sound emitted. This helps us with the midwater trawls to indicate how much we will probably haul.
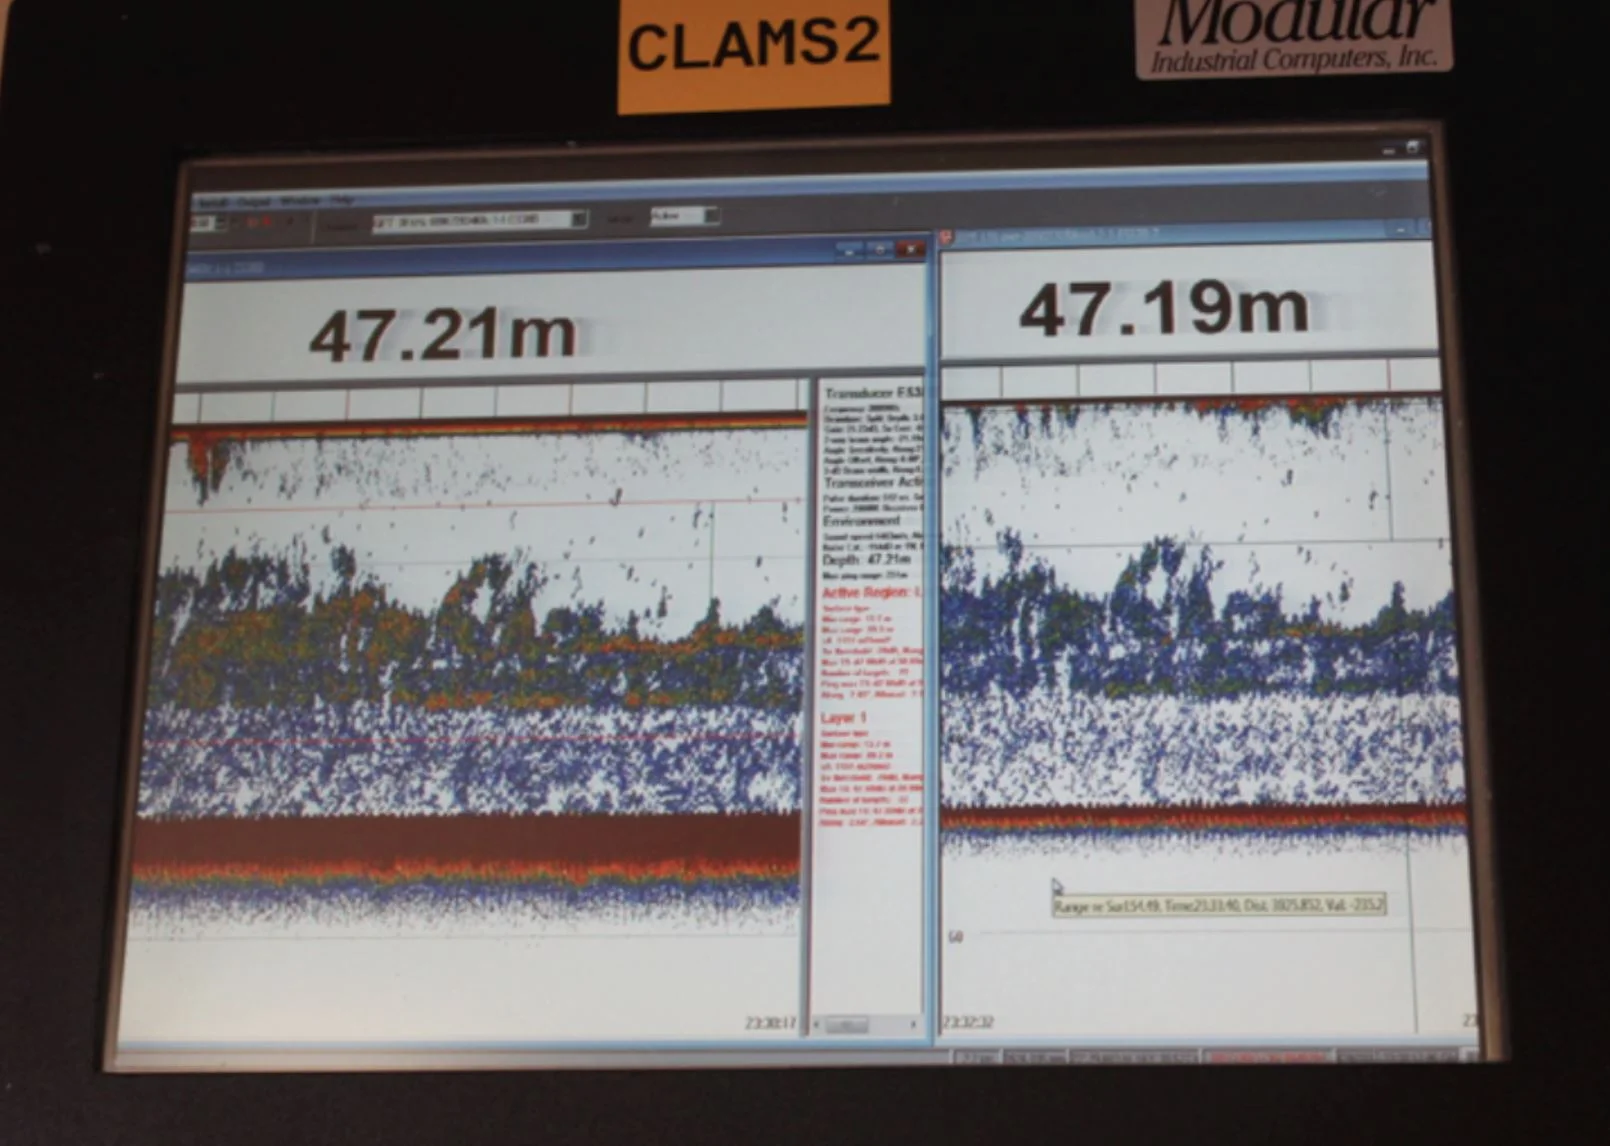
Messages received from the echogram display the distribution and abundance of fish. At 47.21 meters, the deep red lines represent the surface and seafloor. The polychromatic scatter in the middle represents the different fish species. Photo credit: Alicia Flores
Another graph that caught my eye is the one that tells us the different “layers” of the ocean in temperature and salinity. The red line shows the salinity increasing as the CTD goes down in depth while the temperature decreases. And chlorophyll fluorescence kind of measures abundance of phytoplankton shown by the green squiggly line. It makes sense because the sunlight is stronger in shallower depths. Layers of the ocean can be multiple and more complex than this, but phytoplankton like to stay in the perfect salt, temperature and light mixture.
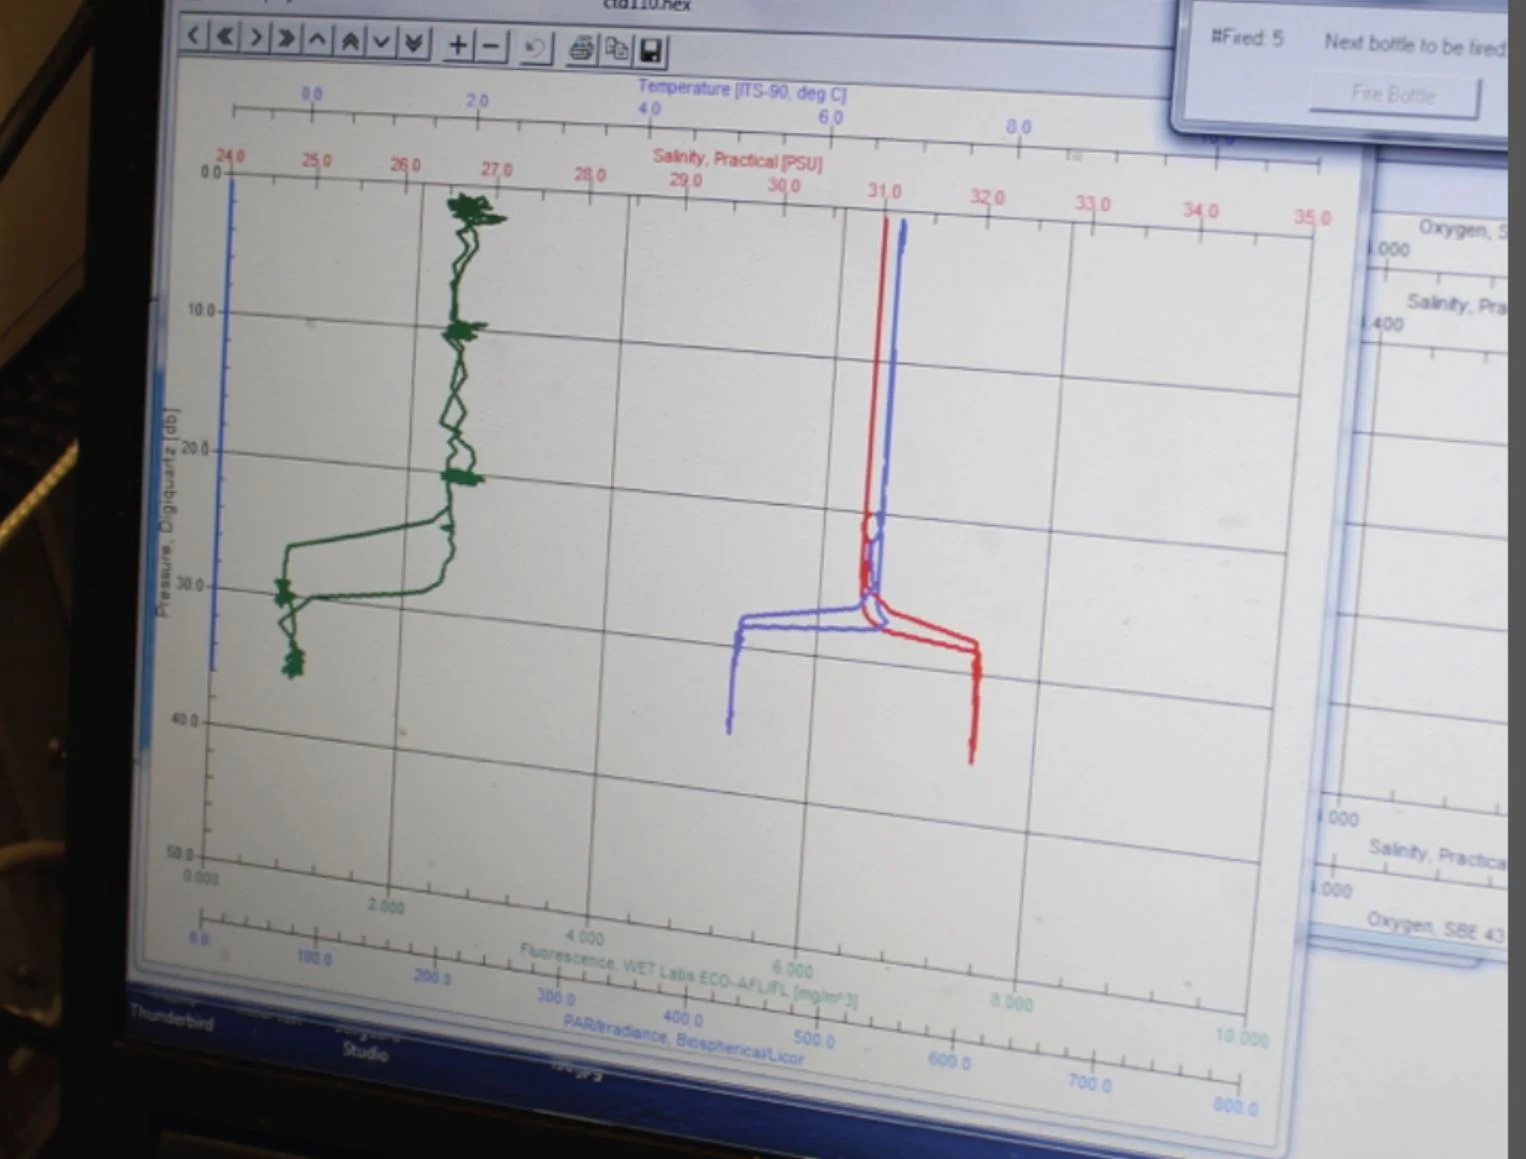
A graph used to tell us what the CTD is sensing as it is lowered down to different depths. Photo credit: Alicia Flores
Seeing these graphs makes you wonder how these creatures below can survive temperatures ranging from -1 degrees Celsius to 10 deg C in many different depths.
One of the many fantastic and visually-compelling organisms is the basket star, an orange bundle of curly legs, of course looks like it is mimicking a basket (when turned upside down); its scientific name is Gorgonocephalus. One of the best moments of sorting fish is when an unexpected creature of a different sort pops out of the trawl. Tiny squid and octopus are a rarity in a catch amongst the abundance of snails, sea stars, crabs and fish. Most of the organisms from the trawls are usually tiny versions of their species, so it's great to see the creatures that grew to be larger than most.

Basket star! Gorgonocephalus sp. in all its glory. Photo credit: Alicia Flores
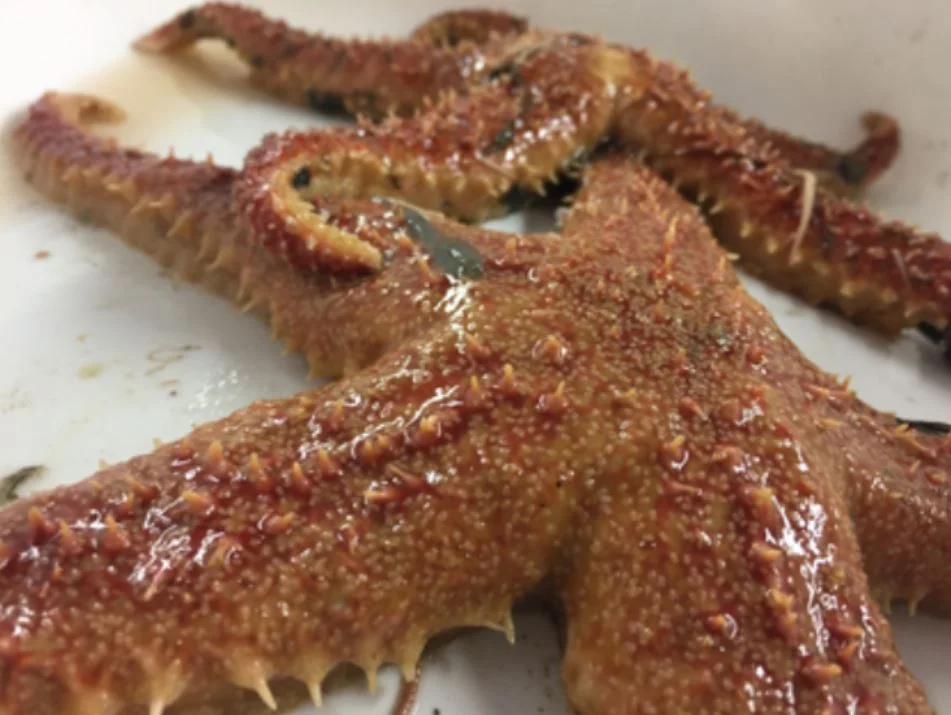
Large sea stars. Photo credit: Alicia Flores
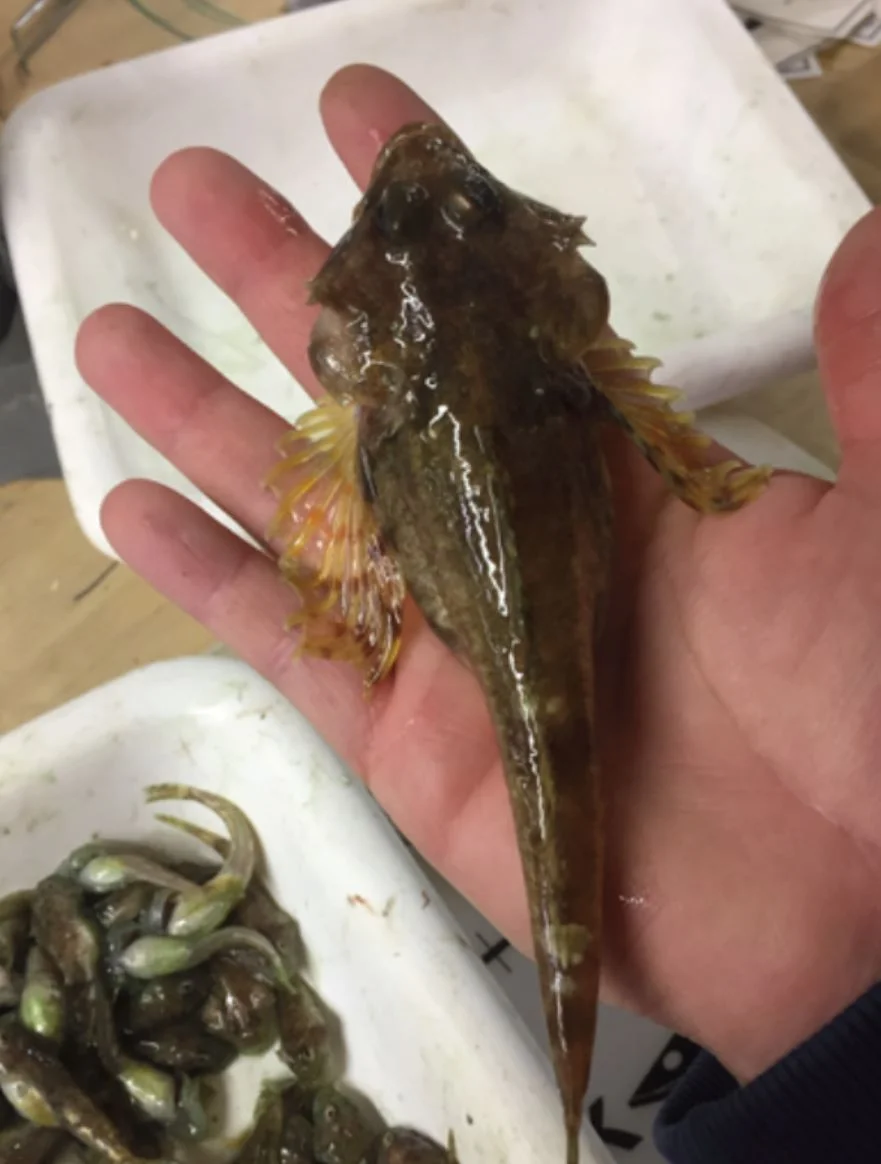
One large shorthorn sculpin! Photo credit: Alicia Flores
Sand dollars showed up near the end of leg 2 covered in thick green algae that settled towards the bottom due to decay, causing everything in the same haul to appear green. I hope I get a chance to see these again on leg 3!

Sand dollars emerge from the bottom trawl! Photo credit: Alicia Flores